


Normal distributions are one of the most important concepts in statistics. They are continuous probability distributions that have a bell-shaped curve. This curve is symmetrical around the mean, which is why it’s called a “normal” distribution. In this article, we’ll discuss the definition of a normal distribution and provide a table with some key values.
What is a Normal Distribution?
A normal distribution is a type of probability distribution that is defined by a symmetric bell-shaped curve. The standard normal distribution is a special case of the normal distribution that is defined by a mean of 0 and a standard deviation of 1. The normal distribution is one of the most widely used distributions in statistics and has many applications in the natural and social sciences.
A normal distribution is a probability distribution that is symmetric around the mean, showing that data points are equally likely to be above or below the mean. The normal distribution is also known as the Gaussian distribution. The standard normal distribution has a mean of 0 and a standard deviation of 1.
Properties of a Normal Distribution:
A normal distribution is a type of probability distribution that is symmetric about the mean. This means that the probability of a value being above or below the mean is equal. The normal distribution is also known as the Gaussian distribution. It is named after Carl Friedrich Gauss, who first studied it in the early 1800s.
The normal distribution is important in statistics because it is used to model many real-world phenomena. For example, heights of people, IQ scores, and blood pressure readings are all normally distributed. The normal distribution is also used in hypothesis testing and in constructing confidence intervals.
We often encounter distributions in real life that look symmetric and bell-shaped. These are called normal distributions. A normal distribution is defined by its center, spread, and overall shape. The center is the mean of the distribution, the spread is the standard deviation, and the shape is described by the skewness and kurtosis.
Normal distributions are important because they arise naturally in many situations. For example, heights of people are (approximately) normally distributed. This means that if we take a sample of people and measure their heights, we expect to see a bell-shaped distribution with most people clustered around the average height.
There are some properties of normal distributions that are worth knowing. First, the mean, median, and mode all fall at the center of the distribution. Second, normal distributions are symmetric around the center; that is, if you fold them in half, they would line up perfectly. Finally, normal distributions have a bell-shaped curve when graphed.
Uses of a Normal Distributions:
There are many different ways that a normal distribution can be used. Some of the most common uses are listed below.
1. To determine how likely it is for an event to occur- A normal distribution can be used to determine the likelihood of an event occurring. For example, if you know that the average height of a person is 5 feet and the standard deviation is 2 inches, you can use a normal distribution to determine the likelihood of a person being 6 feet tall.
2. To predict future events- A normal distribution can also be used to predict future events. For example, if you know that the average weight of a baby born in the United States is 7 pounds and the standard deviation is 1.5 pounds, you can use a normal distribution to predict the weight of a baby born in the future.
3. To understand data sets- A normal distribution can also use to help you understand data sets. For example, if you have a data set that is not evenly distributed, you can use a normal distribution to see if there is a pattern in the data set.
Example based on Normal Distributions:
A normal distribution is a probability distribution that is symmetric about the mean. This means that the probability of a value being above or below the mean is the same. And the normal distribution is also known as the Gaussian distribution.
A normal distribution is defined by its mean and standard deviation. The mean is the average of all the values in the distribution, and the standard deviation is a measure of how spread out the values are.
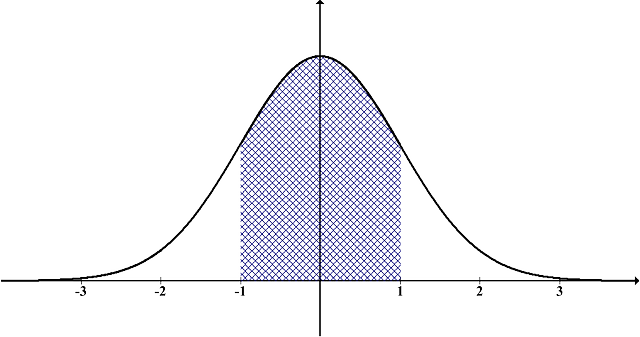
The table below shows an example of a normal distribution with a mean of 0 and a standard deviation of 1.
| x | Probability |
|—|—|
| -3 | 0.0013 |
| -2 | 0.0228 |
| -1 | 0.1587 |
| 0 | 0.5000 |
| 1 | 0.1587 |
| 2 | 0.0228 |
| 3 | 0.0013 |
Normal Distribution Formula:
A normal distribution is a type of probability distribution that defined by a symmetric bell-shaped curve. The standard normal distribution is a special case of the normal distribution where the mean is equal to zero and the standard deviation is equal to one. Also, the normal distribution also known as the Gaussian distribution.
The normal distribution is often use to model data that are continuously distributed, such as height, weight, and IQ scores. And the normal distribution is also used in many statistical tests, such as the z-test and t-test.
The formula for the normal distribution is:

where:
μ is the mean of the distribution
σ is the standard deviation of the distribution
x is a value from the distribution
The normal distribution has several properties that make it useful for modeling data:
The mean, median, and mode are all equal.
The curve is symmetric around the mean.
The curve approaches but never reaches the x-axis.
As σ gets larger, the curve becomes flatter.
Conclusion:
A normal distribution is a type of probability distribution that has a bell-shaped curve. It is also known as the Gaussian distribution. This article has provided you with a brief introduction to the normal distribution and its properties. If you want to learn more about this topic, there are many resources available online and in libraries.